



Long wick = reversal? Not always
A long wick shows rejection inside one candle, not a guaranteed turn.
 An ivish.studio lesson
Episode 5 · Series S1: Candle basics · Comment keyword: WICK
Takeaway: A long upper wick shows rejection inside one candle. It does not tell you what comes next. The same shape can be followed by a drop or by a rise. A wick is a clue, not a signal.
Hindi: Wick ek clue hai, signal nahi. Faisla structure karta hai.
Watch the reel
The idea in plain words
A long upper wick means price went up during the candle, could not hold there, and was pushed back down before the candle closed. That is rejection, and it is real, but it happened inside that one candle.
What happens after is a separate question. One wick on its own cannot answer it. Shorting every long upper wick treats a clue as if it were a signal.
How we measure wick length: upper wick divided by the candle’s full high-to-low range. Upper wick = high minus the top of the body.
Step by step
Step 1: Measure the wick
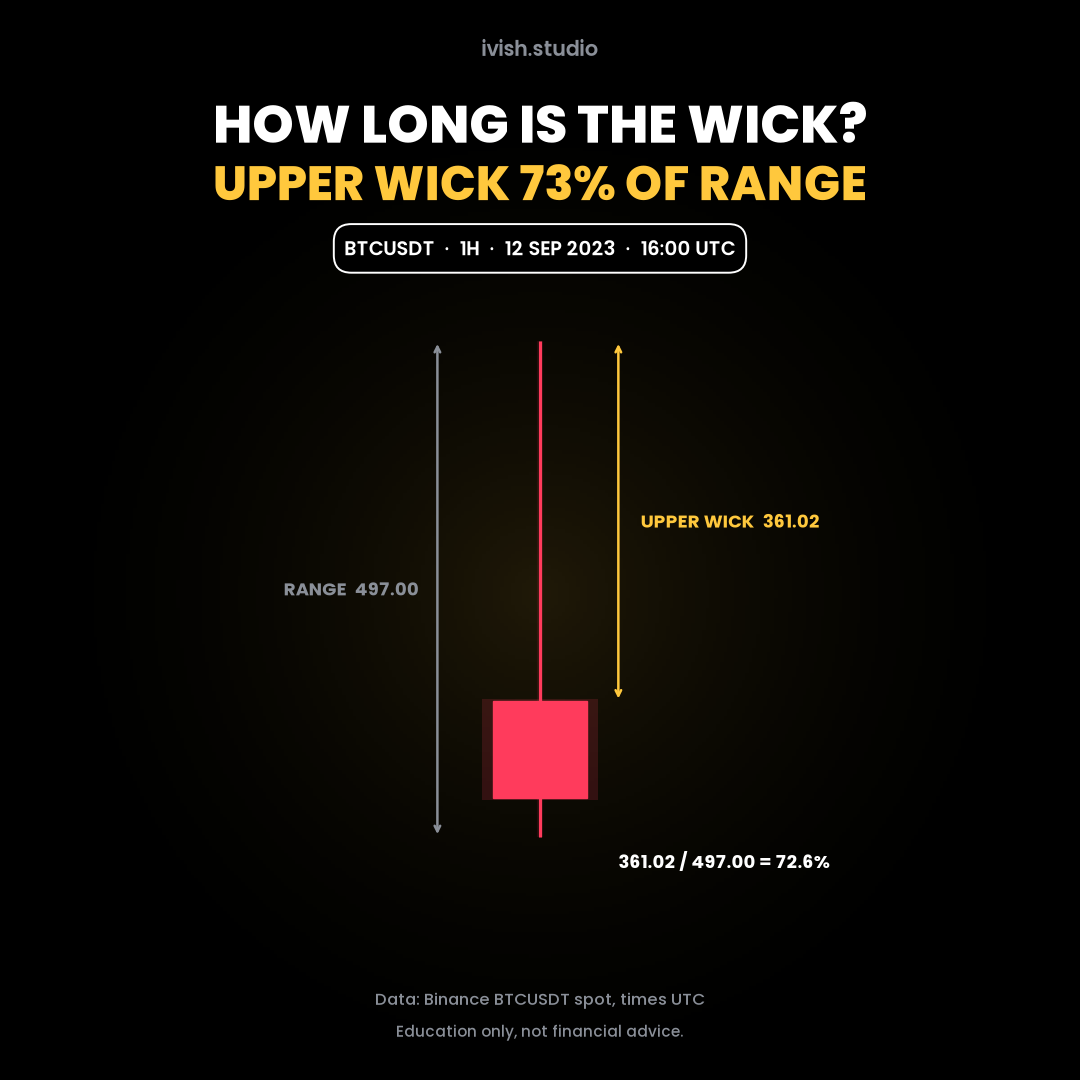
Bitcoin (BTCUSDT spot), 1-hour candle at 16:00 UTC on 12 Sep 2023: open 26,205.98, high 26,567.00, low 26,070.00, close 26,109.32.
- Upper wick = 26,567.00 minus 26,205.98 = 361.02.
- Range = 26,567.00 minus 26,070.00 = 497.00.
- Wick share = 361.02 / 497.00 = about 73%.
Step 2: Case A, price went lower
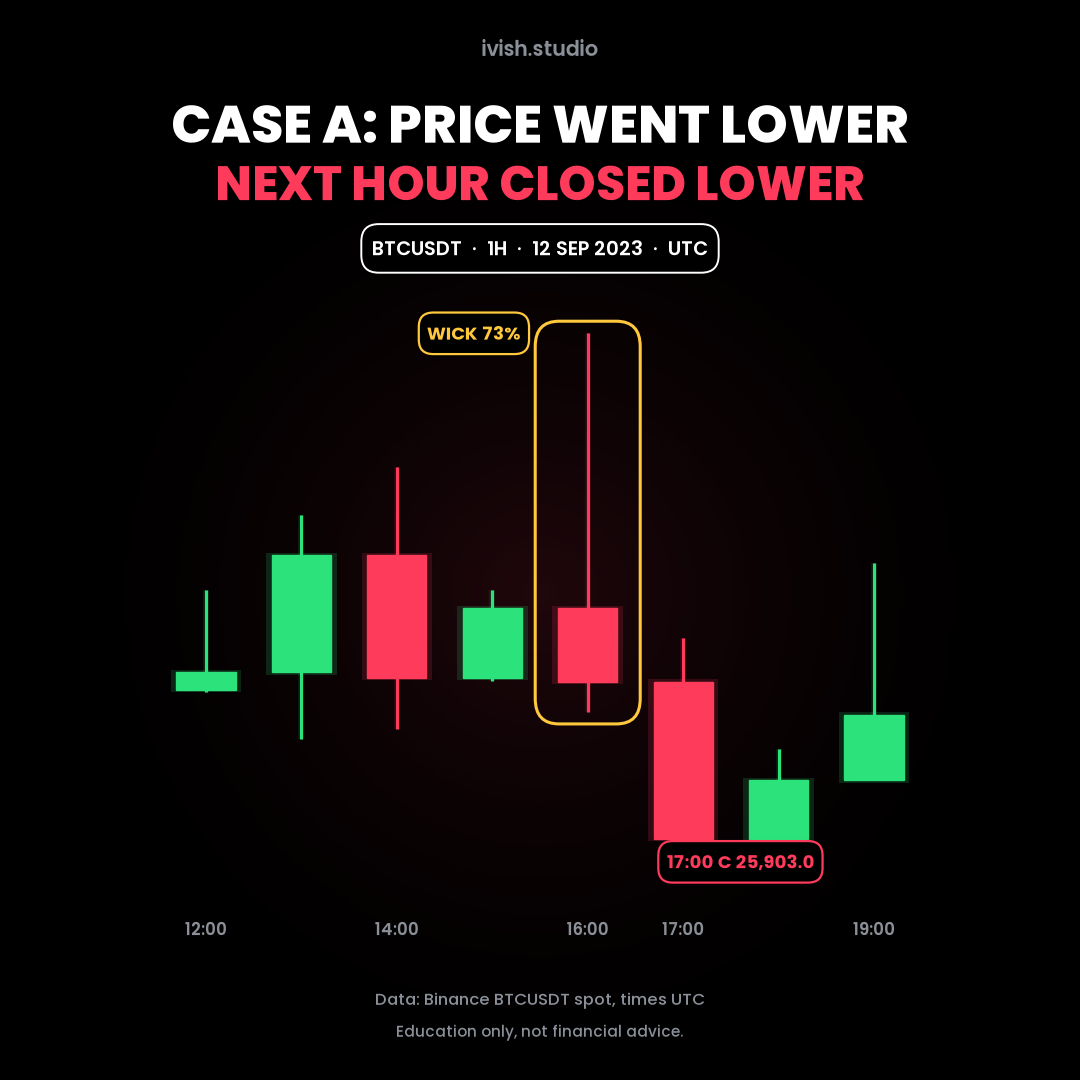
The next 1-hour candle (17:00 UTC) closed at 25,903.04, below the wick candle’s close. Here the wick was followed by a move down.
Step 3: Case B, same shape, price went higher
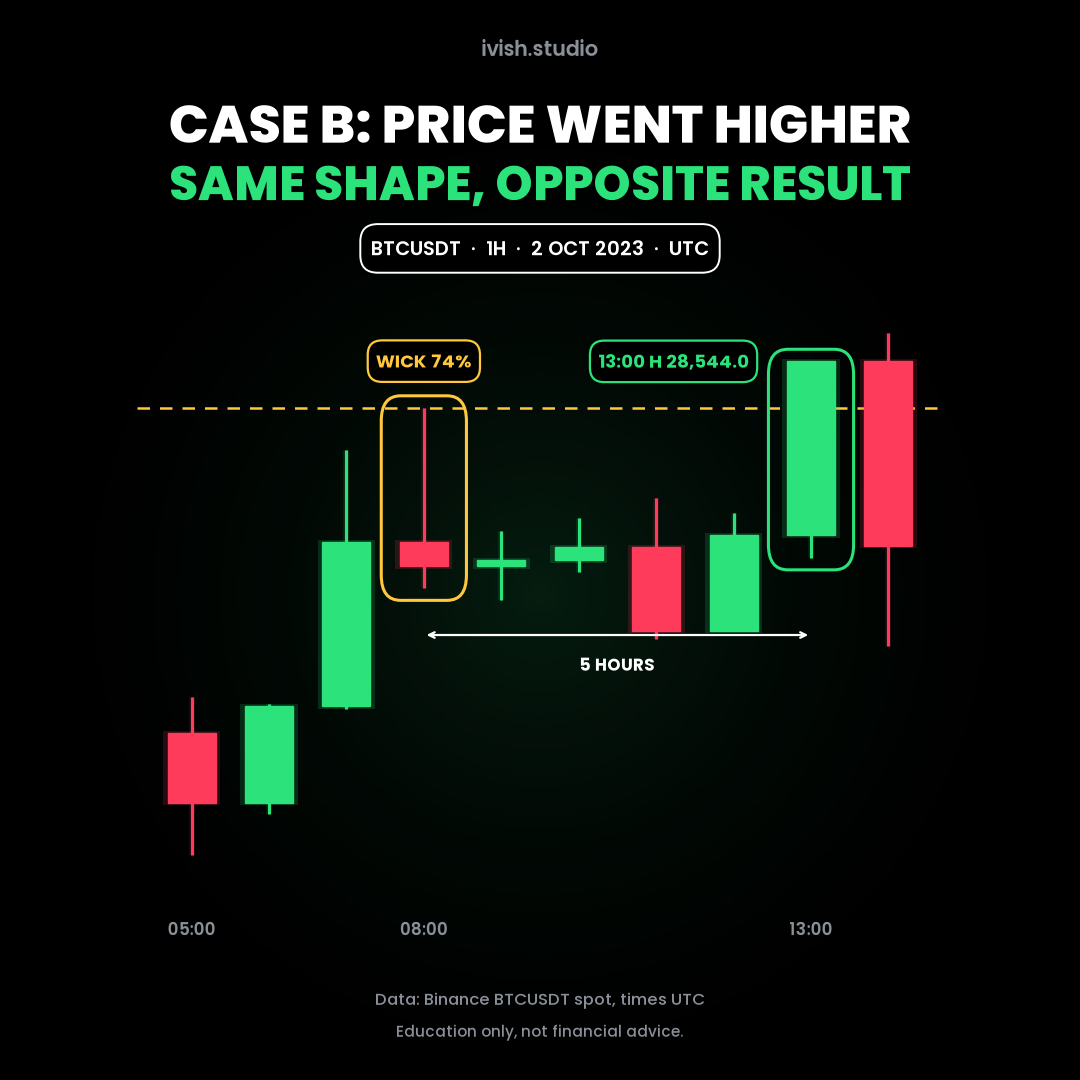
Bitcoin, 1-hour candle at 08:00 UTC on 2 Oct 2023: open 28,311.91, high 28,484.28, low 28,252.84, close 28,280.94. Upper wick 172.37 out of a 231.44 range, about 74%. Almost the same shape as Case A.
Five hours later, the 13:00 UTC candle traded above that high (high 28,544.00) and closed at 28,544.00, above it too.
Same shape, opposite result. The two charts are on different price scales, so compare the shapes, not the heights.
Step 4: What decides
A wick tells you where price was rejected for a moment. Market structure, covered in the next series, is what you use to judge direction. The wick gets its main job later, in the swing failure pattern (SFP), where a wick goes beyond a level and the close comes back inside.
Common mistakes
- Shorting every long upper wick. Case B shows how that can go wrong.
- Ignoring the timeframe. A long wick on 1H can be a small detail on 4H.
- Comparing wick heights across charts. Use the wick’s share of its own range.
- Treating two examples as statistics. Two cases prove “not always”. They say nothing about how often.
Try it yourself
- Find three 1H candles on BTCUSDT with an upper wick over 60% of their range.
- For each, note what the next five candles did.
- Count how many went lower and how many went higher.
- Note where each wick formed: at a clear level, or in the middle of nowhere.
Previous lesson
Previous: Episode 4: One 4H candle, four 1H candles · /trading/learn/004-one-4h-candle-four-1h-candles
Data: Binance BTCUSDT spot 1-hour candles, times in UTC, re-checked against the Binance public klines API.
Education only, not financial advice.
ivish.studio