



One 4H candle, four 1H candles
Every candle is a block of time, and bigger timeframes are built from smaller ones.
 An ivish.studio lesson
Episode 4 · Series S1: Candle basics · Comment keyword: 4H
Takeaway: Every candle is a block of time. A 4-hour candle is built from the four 1-hour candles inside it, so the same move can look red on one timeframe and green on another. Always read the timeframe first.
Hindi: Ek 4H candle mein chaar 1H candles. Bina timeframe, candle adhoori hai.
Watch the reel
The idea in plain words
A 1H candle covers one hour. A 4H candle covers four hours. So one 4H candle contains four 1H candles, and its four prices come straight from them:
- Open = the open of the first 1H candle.
- High = the highest high of the four.
- Low = the lowest low of the four.
- Close = the close of the last 1H candle.
This is how “red on 1H, green on 4H” can both be true at the same moment.
Step by step
Step 1: Take four real 1H candles
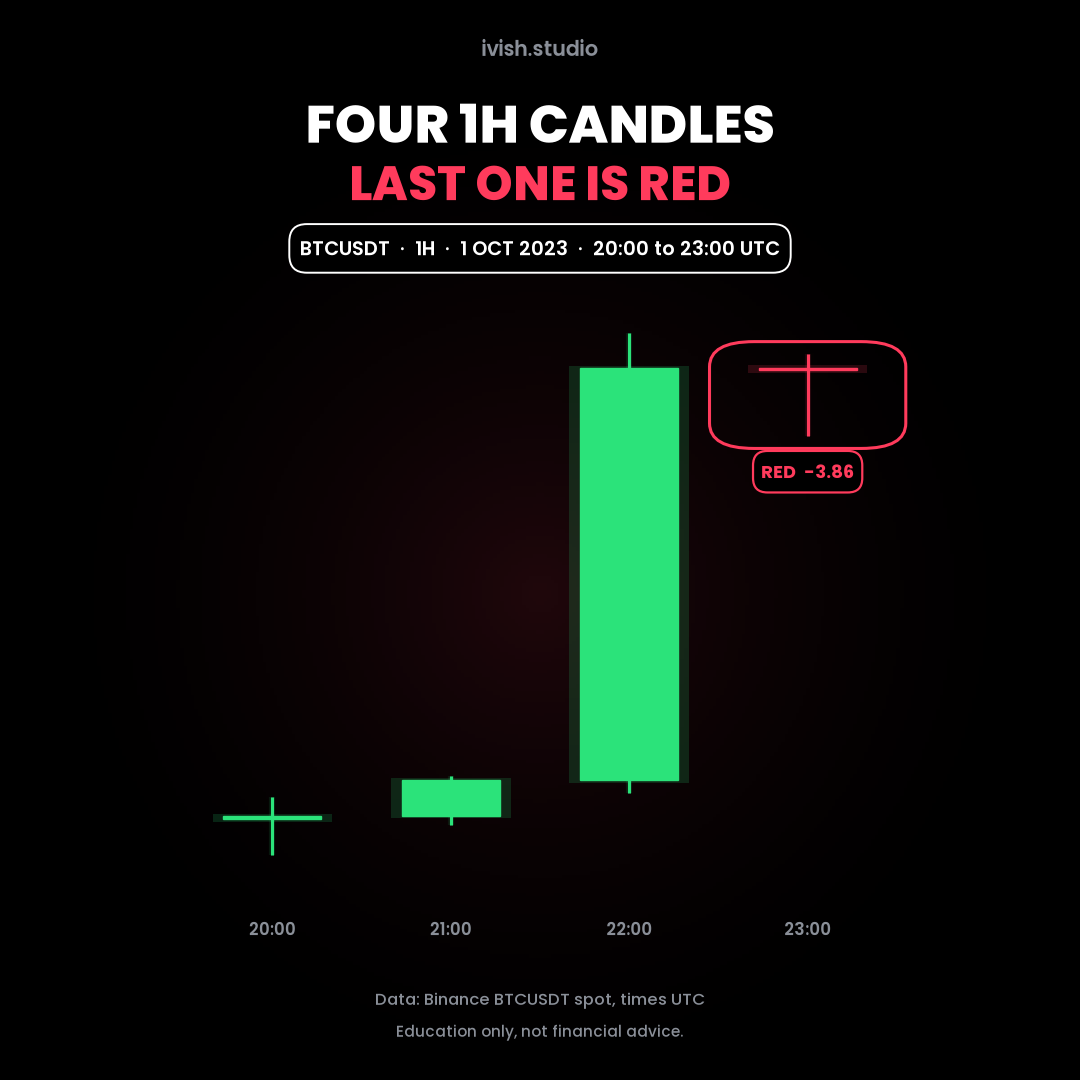
Bitcoin (BTCUSDT spot), 1 Oct 2023, UTC:
| 1H candle | Open | High | Low | Close | Colour |
|---|---|---|---|---|---|
| 20:00 | 27,103.02 | 27,147.00 | 27,033.10 | 27,109.75 | green |
| 21:00 | 27,109.75 | 27,187.99 | 27,091.78 | 27,180.37 | green |
| 22:00 | 27,180.38 | 28,065.51 | 27,155.00 | 27,996.43 | green |
| 23:00 | 27,996.43 | 28,025.12 | 27,861.47 | 27,992.57 | red |
The last one is red: it closed 3.86 below its open.
Step 2: Combine them into one 4H candle
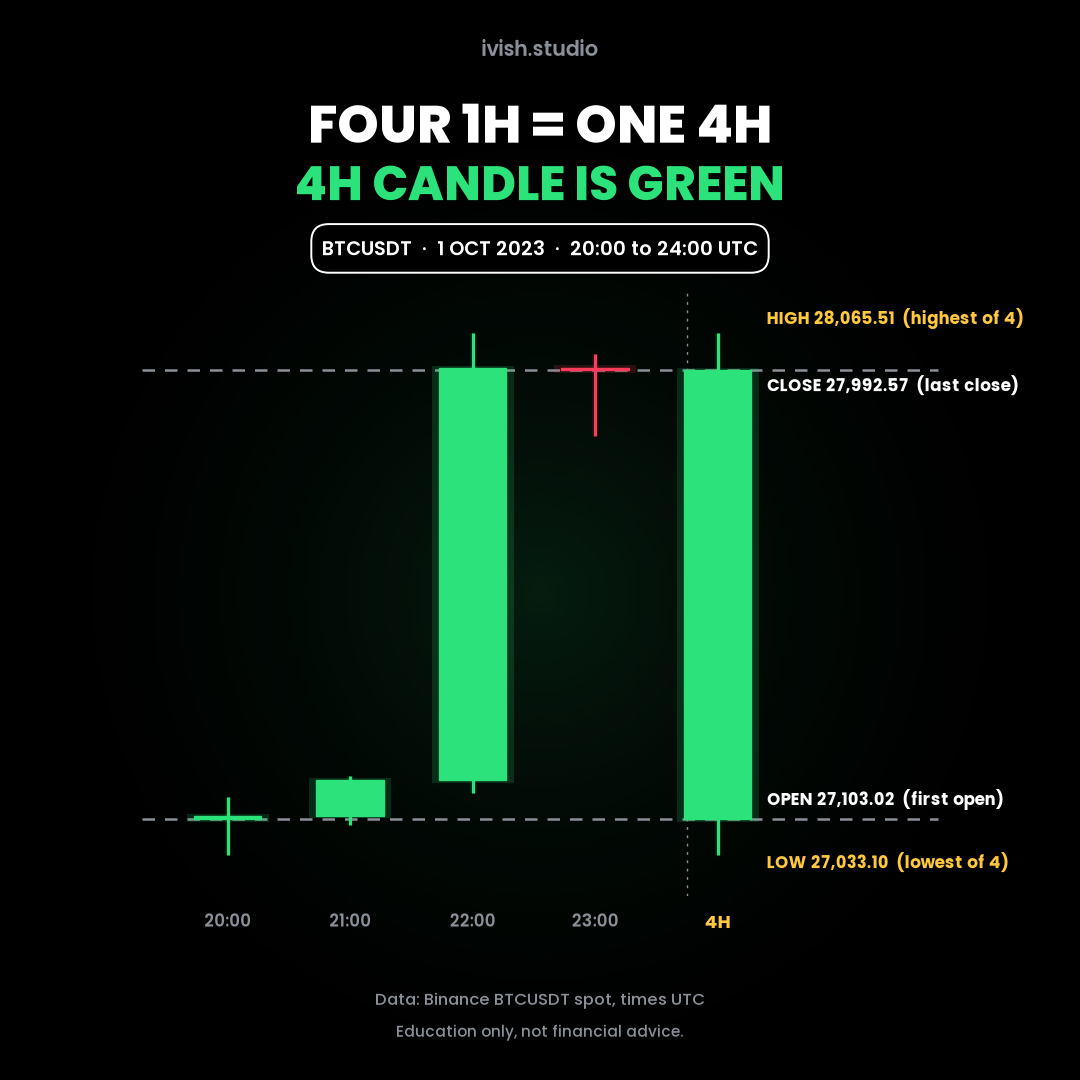
- Open = 27,103.02 (first open)
- High = 28,065.51 (highest of the four, from 22:00)
- Low = 27,033.10 (lowest of the four, from 20:00)
- Close = 27,992.57 (last close)
Close minus open = +889.55, so the 4H candle is green, even though the last 1H candle is red. Binance’s own 4H candle for 20:00 UTC shows exactly these four prices.
Step 3: See it on the 4H chart
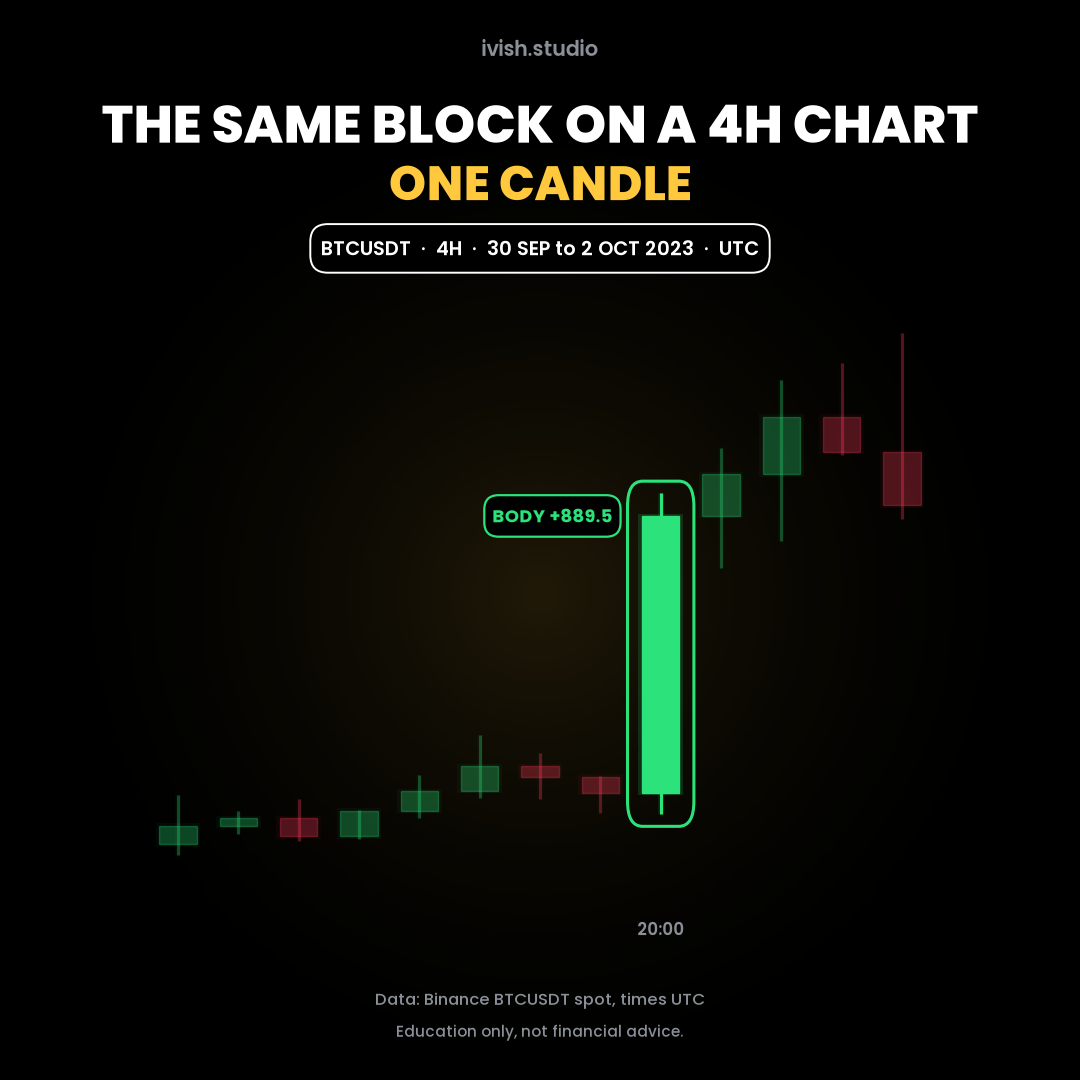
On a 4H chart those four hours are a single candle. Nothing changed in the market. Only the size of the time block changed.
Where do 4H candles start? On Binance they start at 00:00, 04:00, 08:00, 12:00, 16:00 and 20:00 UTC. Some chart platforms let you set a different timezone or session, which can shift where the 4H blocks begin, so the same 1H data can produce different 4H candles. Check your chart’s settings.
Common mistakes
- Combining any four 1H candles in a row. They have to be the four that sit inside one 4H block.
- Reading a candle without its timeframe. “A red candle” means nothing until you know if it is 1m, 1H or 4H.
- Thinking timeframes disagree. They are the same price data grouped into different time blocks.
- Taking the 4H close as the average. The close is simply the last 1H close, not an average.
Try it yourself
- Open BTCUSDT on 1H and pick a 4H block (for example 08:00 to 11:00 UTC).
- Write down the four 1H candles’ open, high, low and close.
- Build the 4H candle by hand: first open, highest high, lowest low, last close.
- Switch to 4H and compare. Do they match?
- Check which timezone your charting platform uses.
Next lesson
Episode 5: Long wick = reversal? Not always · /trading/learn/005-long-wick-not-always-reversal · comment WICK
Previous: Episode 3: Red candle means crash? No · /trading/learn/003-red-candle-not-a-crash
Data: Binance BTCUSDT spot 1-hour and 4-hour candles, times in UTC, re-checked against the Binance public klines API.
Education only, not financial advice.
ivish.studio