



One candle, four prices
Open, high, low and close, read off one real candle.
 An ivish.studio lesson
Episode 2 · Series S1: Candle basics · Comment keyword: OHLC
Takeaway: Every candle is a block of time that carries four prices: open, high, low and close. Colour is only one part of what a candle tells you.
Hindi: Har candle ek time block hai, aur usme chaar price hote hain: open, high, low, close.
Watch the reel
The idea in plain words
If you only read a candle as “green” or “red”, you are missing most of it. Each candle covers one fixed block of time (one hour on a 1H chart) and records four prices from that block:
- Open: the first traded price of the block.
- High: the highest price reached in the block.
- Low: the lowest price reached in the block.
- Close: the last traded price of the block.
The candle is drawn from those four numbers:
- The body runs from the open to the close.
- The wicks run from the body up to the high and down to the low.
- The candle is green when the close is above the open, and red when it is below.
Step by step
Step 1: Read the four prices off one real candle
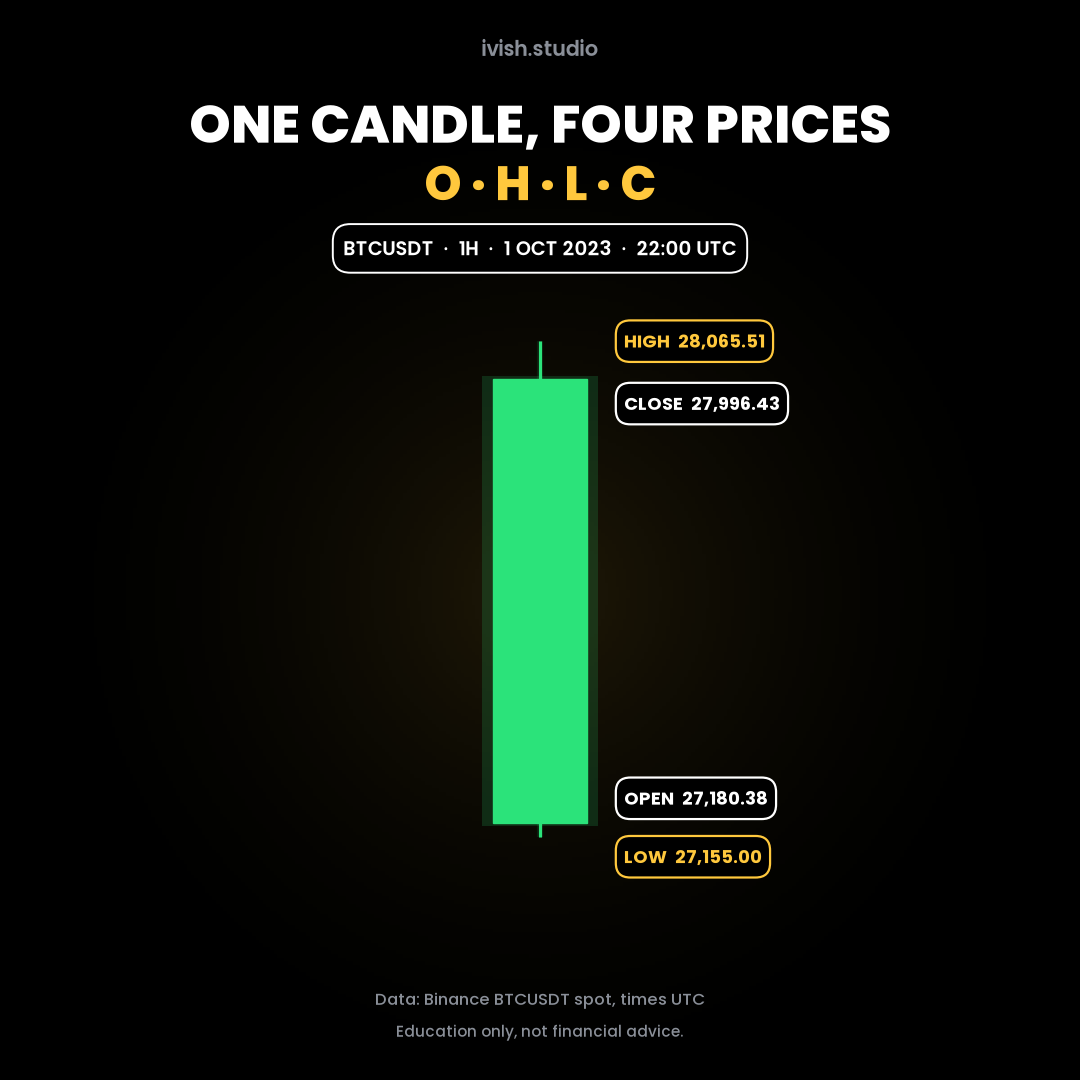
Bitcoin (BTCUSDT spot), 1-hour candle at 22:00 UTC on 1 Oct 2023. This is the same candle that broke the level in Episode 1.
| Price | Value |
|---|---|
| Open | 27,180.38 |
| High | 28,065.51 |
| Low | 27,155.00 |
| Close | 27,996.43 |
Step 2: Build the body and the wicks
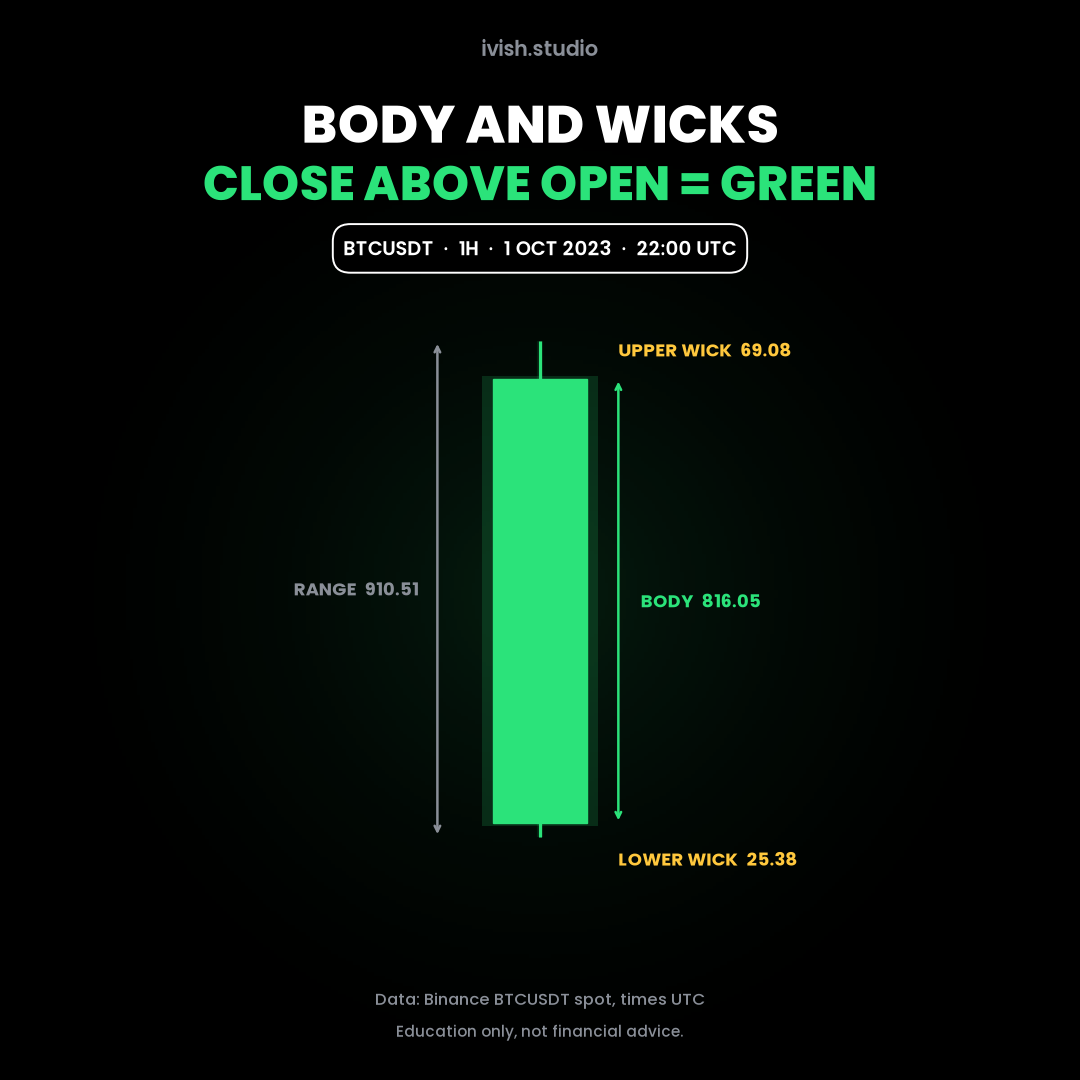
- Body = close minus open = 816.05. Close is above open, so the candle is green.
- Upper wick = high minus close = 69.08.
- Lower wick = open minus low = 25.38.
- Range = high minus low = 910.51.
Note: the candle alone does not tell you in which order the high and the low printed during the hour. It only gives the four prices.
Step 3: See why the low matters
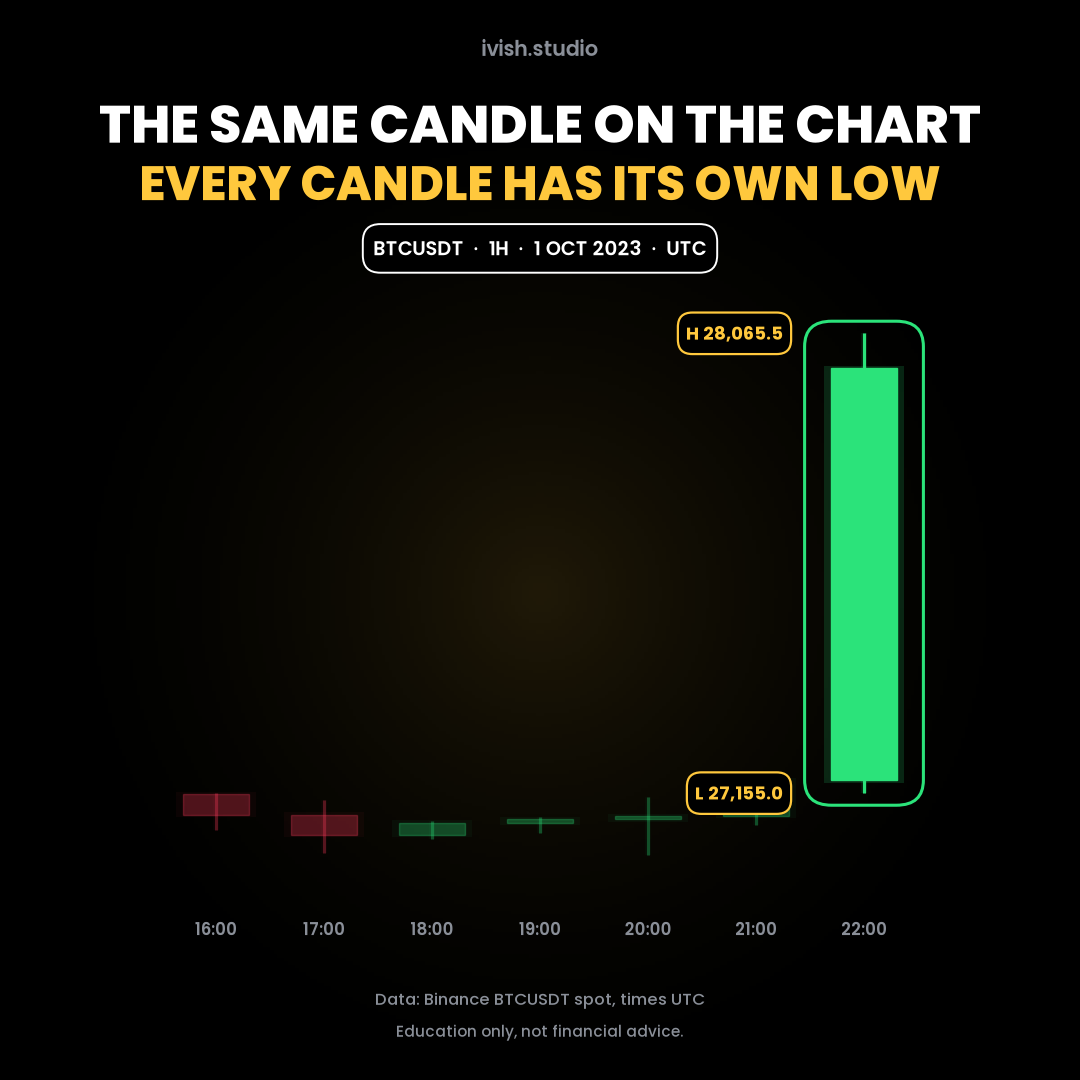
Every candle has its own low. When traders talk about a “swing low”, they mean the low of one specific candle. In a long (buy) trade, a stop is often placed just below a swing low, so knowing how to read a candle’s low is a basic skill you use in risk planning later in the series.
Common mistakes
- Reading only the colour. Green does not mean “buy” and red does not mean “sell”. Colour only compares the close with the open.
- Confusing the body with the range. The body is open to close. The range is high to low, wicks included.
- Assuming the order inside the candle. A green candle can print its low first or its high first. The four prices do not say which.
- Forgetting the time block. The same four prices mean nothing without knowing the timeframe.
Try it yourself
- Pick any 1H candle on a BTCUSDT chart and write down its open, high, low and close.
- Work out its body, upper wick, lower wick and range.
- Decide its colour from the numbers alone before looking at it.
- Find a nearby swing low and note which candle it belongs to.
Next lesson
Episode 3: Red candle means crash? No · /trading/learn/003-red-candle-not-a-crash · comment COLOUR
Previous: Episode 1: Wick vs Close · /trading/learn/001-wick-vs-close
Data: Binance BTCUSDT spot 1-hour candles, times in UTC, re-checked against the Binance public klines API.
Education only, not financial advice.
ivish.studio