



Red candle means crash? No
Colour only compares the close with the open; body size shows how far it moved.
 An ivish.studio lesson
Episode 3 · Series S1: Candle basics · Comment keyword: COLOUR
Takeaway: A candle’s colour only says whether it closed above or below its own open. How far price moved shows in the size of the body, not in the colour.
Hindi: Colour sirf close vs open batata hai. Taakat body ke size se dikhti hai, colour se nahi.
Watch the reel
The idea in plain words
The colour rule is simple:
- Close above open = green.
- Close below open = red.
That is all colour tells you. It compares the candle with itself, not with the candle before it, and it says nothing about size. A red candle can be tiny and sit near the top of a move. Panic-selling because one candle turned red is reacting to colour, not to what price actually did.
Step by step
Step 1: The colour rule on two real candles
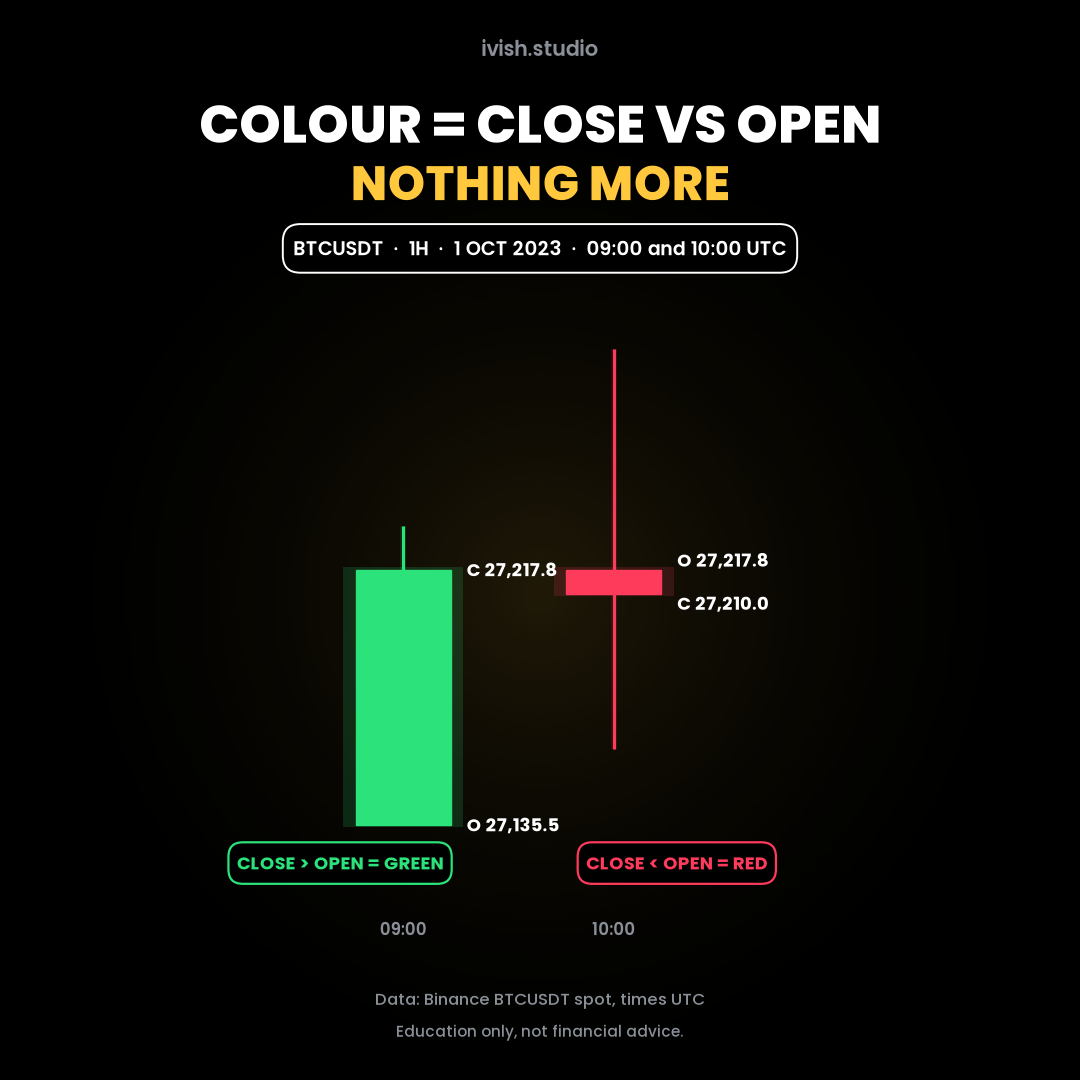
Bitcoin (BTCUSDT spot), 1-hour candles on 1 Oct 2023:
- 09:00 UTC: open 27,135.47, close 27,217.77. Close above open, so green.
- 10:00 UTC: open 27,217.78, close 27,210.01. Close below open, so red.
Step 2: Look at what the red candle actually did
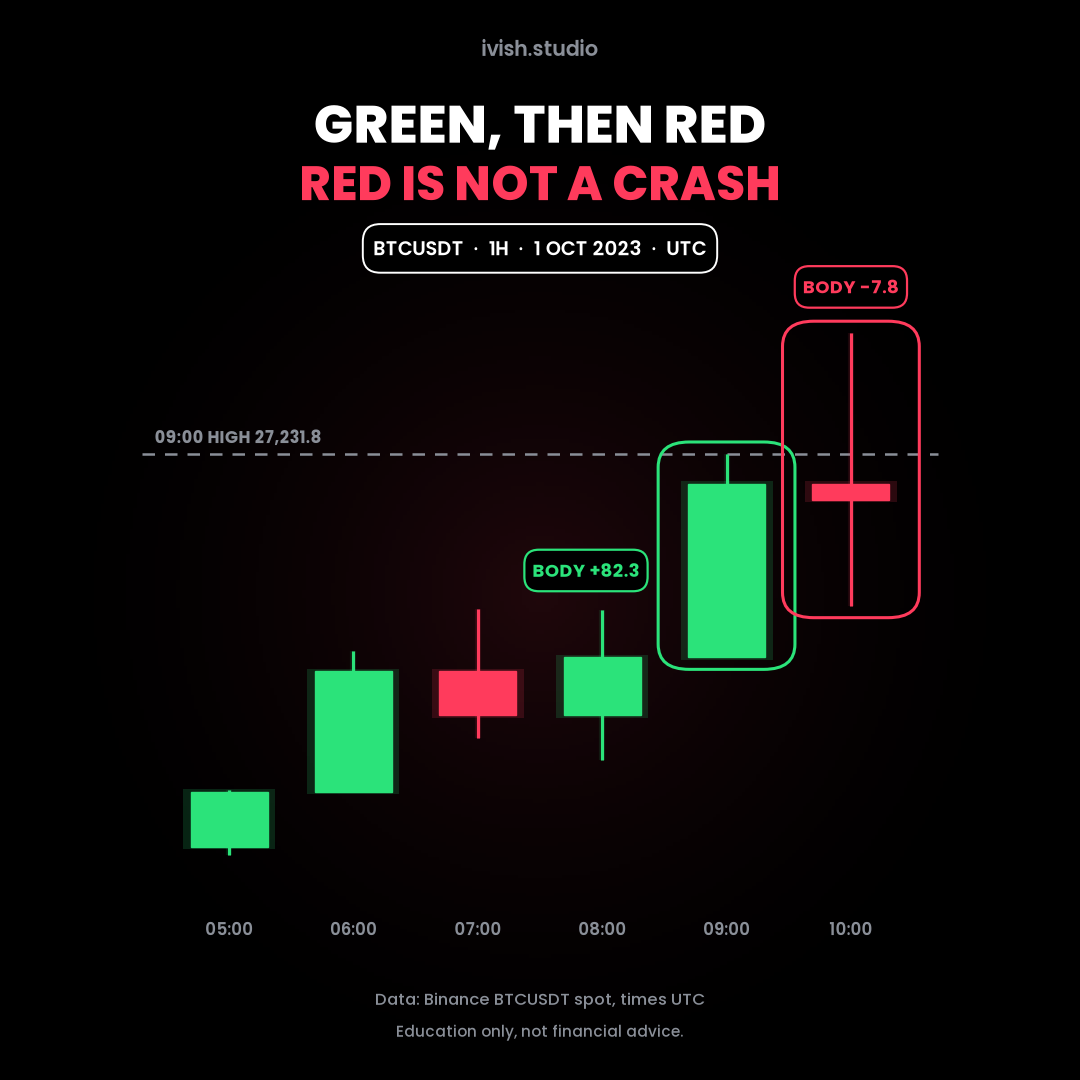
- The green candle’s body is +82.30.
- The red candle’s body is only -7.77.
- The red candle’s high (27,289.08) went 57.27 above the green candle’s high (27,231.81).
- The red candle closed just 7.76 below the green candle’s close, and still well above the green candle’s open.
Red, yes. A crash, no.
Step 3: Compare body sizes, not colours
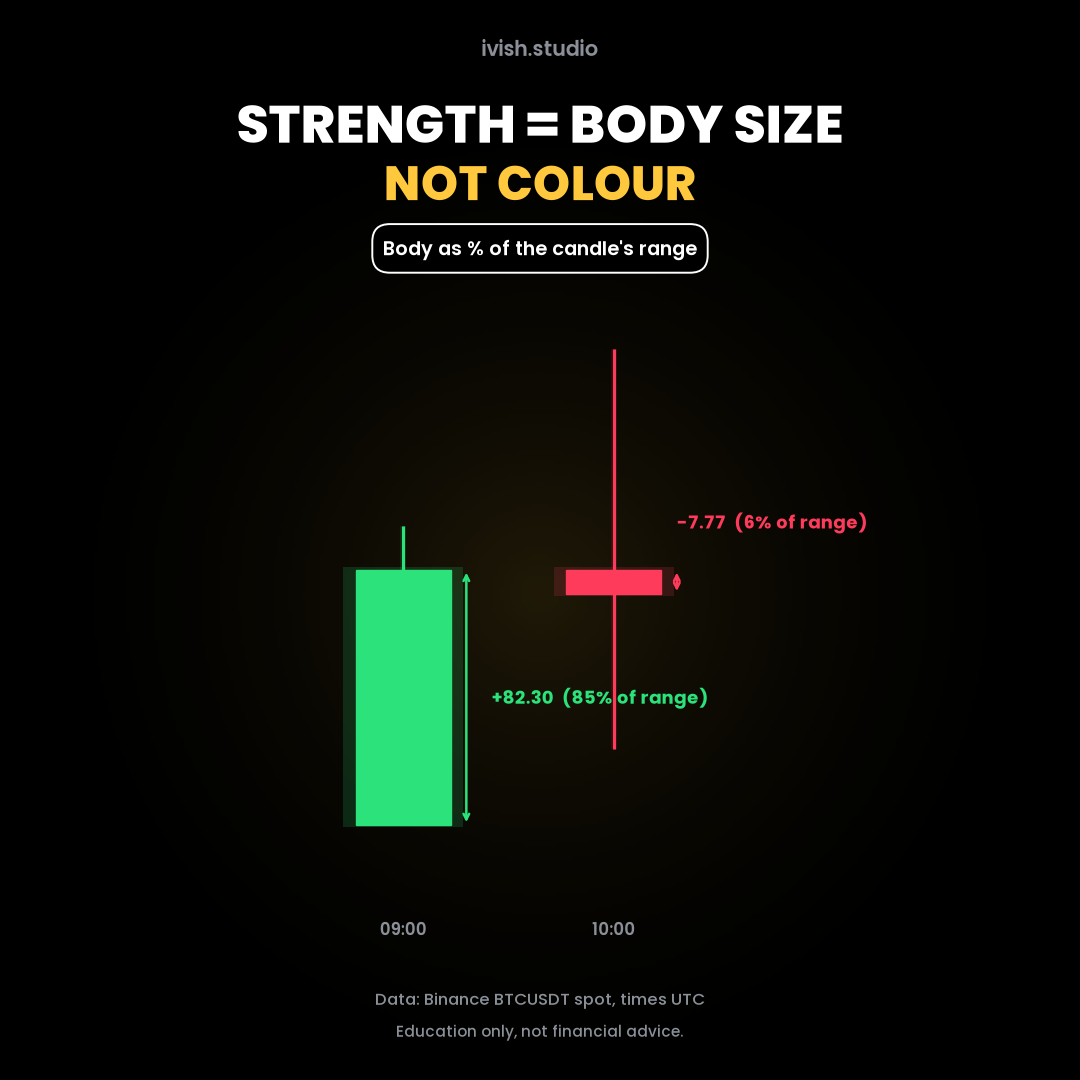
- Green candle: the body is about 85% of its high-to-low range. Most of the hour’s movement was one-way.
- Red candle: the body is about 6% of its range. Price moved around but ended almost where it started.
Body size shows how far price moved from open to close. That says far more than the colour.
Common mistakes
- “Red = sell.” Colour alone is not a signal.
- Comparing with the previous candle. Colour compares close with the candle’s own open. A red candle can close above the previous candle’s open, as here.
- Ignoring size. A tiny red body after a large green one is a very different picture from a large red body.
- Calling every small body a doji. This red candle has a small body, but doji is its own topic (Episode 6).
Try it yourself
- On a BTCUSDT 1H chart, find a red candle right after a big green one.
- Measure both bodies (close minus open).
- Check whether the red candle closed above the green candle’s open.
- Write one sentence about what price did, without using the words green or red.
Next lesson
Episode 4: One 4H candle, four 1H candles · /trading/learn/004-one-4h-candle-four-1h-candles · comment 4H
Previous: Episode 2: One candle, four prices · /trading/learn/002-one-candle-four-prices
Data: Binance BTCUSDT spot 1-hour candles, times in UTC, re-checked against the Binance public klines API.
Education only, not financial advice.
ivish.studio